Machine learning / Regression
ML Used Vehicle Regression Project
- Role
- Machine Learning Analyst
- Status
- Complete
- Skills used
- Python
- pandas
- NumPy
- scikit-learn
- Matplotlib
- Seaborn
Research question
What factors were most important for influencing asking price for used vehicles on Craigslist in Spring 2021?
The dataset
Source: Craigslist Cars and Trucks dataset by Austin Reese
I used Craigslist vehicle listings to see how asking price relates to seven details about each vehicle and listing. These are the prices sellers posted, which may differ from what the vehicles actually sold for.
Fields I used
- Vehicle year
- Odometer
- Manufacturer
- Condition
- Title status
- Vehicle type
- State
- source listings
- 426,880
- prepared rows
- 259,125
- predictor groups
- 7
Preparing the data
Choose the columns
I used asking price as the value to predict and kept seven vehicle and listing fields as inputs. I left the other source columns out of this first model.
Remove extreme prices and mileage
I kept prices above $1,000 and no higher than the 99th percentile. I also kept odometer readings from zero through their 99th percentile. I left unusual vehicle years in place because some could be classic cars.
Fill gaps and remove duplicates
I labeled missing category values as “unknown” and removed rows that were duplicates across the columns I selected. I did not separately fill in missing vehicle years.
Prepare the categories
I one-hot encoded manufacturer, condition, title status, vehicle type, and state so the model could use them. That left 259,125 rows and 124 predictor columns.
Testing the model
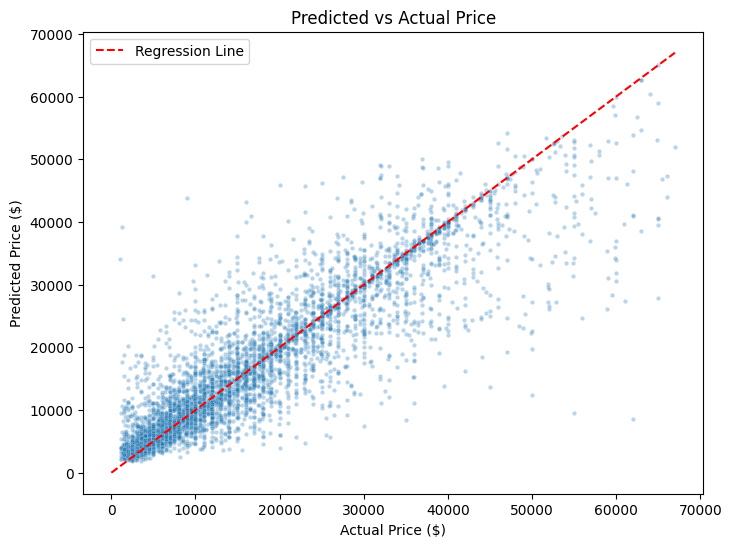
I trained a 100-tree random forest using a random 80/20 train/test split. To give the error some context, I compared it with a simple baseline: predict the training set’s median asking price for every test listing. The plot shows 5,000 test predictions. Points on the red diagonal would be perfect predictions.
Method Random forest regression
- Model MAE
- $3,657
- Test R²
- 0.783
- Baseline MAE
- $10,146
On the held-out test set, predictions were off by this much on average, rounded to the nearest dollar.
The model explained about 78% of the asking-price variation in the test set.
Average error from predicting the training set’s median price for every test listing.
Feature importance
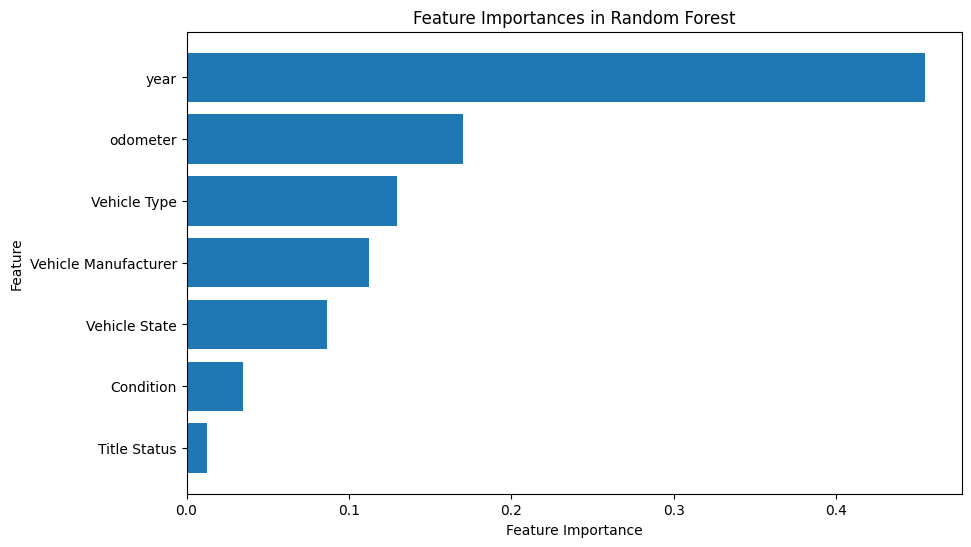
Vehicle year stood out most in the model, with odometer next. Vehicle type and manufacturer followed. State, condition, and title status had smaller importance scores.
Project notebook
Scroll inside the notebook to read the original code and saved results.